Measuring PAR Distribution Across a 90P Using the Original ADA Solar RGB
Nineteen underwater readings across a 90 cm tank under one ADA Solar RGB. The full method, the raw data, and what the distribution shows.
Introduction
Published PAR figures for aquarium lights are more thorough than they are often given credit for. Several manufacturers put out tables, and there are crowd-sourced databases of independently taken readings. What those figures describe is the fixture, measured on a grid at a stated height over open water. What none of them describe is what arrives at a particular plant, at the depth its canopy actually sits, in a tank that is already planted. That is the gap this survey fills, and for this fixture there is a second one: ADA publishes no PAR at all, only lux.
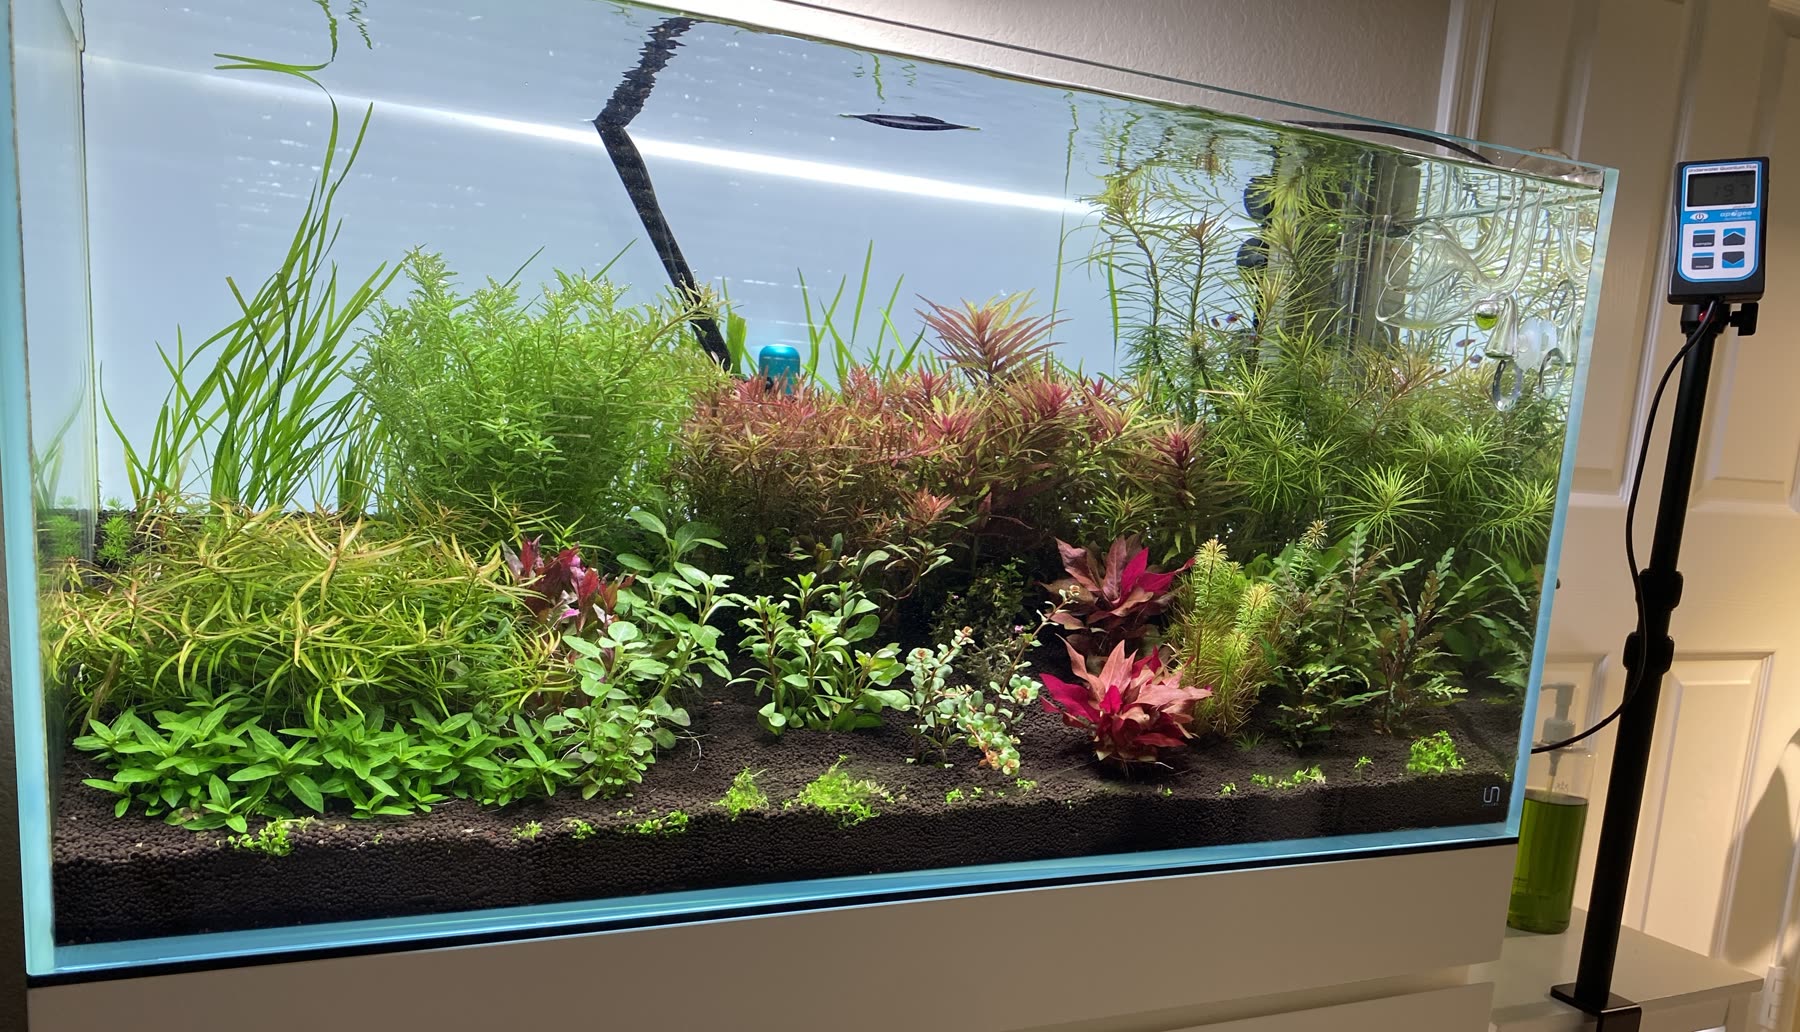
I measured nineteen instead, on the 8th of August 2026, with an Apogee MQ-510 held underwater at each planted position. The tank is a 90P, 90 cm wide, under one ADA Solar RGB I bought from Aqua Forest Aquarium around 2020.
This replaces two earlier runs, and the distinction between them matters. The run on the 1st of August covered seventeen positions and did record depth and fixture height against every reading. The run on the 2nd covered all twenty but carried neither. So there was no single earlier survey that was both complete and dimensionally reproducible, which is why this one was taken from scratch rather than assembled from the two. It is nineteen positions with depth and fixture height on every reading, and it is the survey every figure below is drawn from.
Nineteen positions rather than twenty because position 5 no longer exists. The Myriophyllum mattogrossense 'Golden' planted there melted during the cycling period, leaving no canopy to hold a sensor at. Its last reading was 70 µmol on the 2nd of August, inside the 60 to 100 working range used for it here, though without a depth recorded against it. So the plant was lost despite a light reading inside its working range, and light alone does not explain the loss. A working range describes light and nothing else.
Project Goal
I wanted a measured picture of what reaches each plant where it actually stands, rather than a figure describing the fixture over open water.
I also wanted a baseline I could re-run, so that changing the height or the fixture means comparing numbers rather than memories.
Equipment Used
Each item has its own page. Status and service dates there are read from the inventory that runs the tank, so they cannot drift from what is installed.
Tank Configuration
The fixture is a good deal narrower than the tank is wide. Keep that in mind for everything below; it bears on most of what the readings show.
The ADA Shade is on the fixture and was on for every reading. ADA states it prevents light leakage and enhances downward illuminance by up to approximately 15%. Two things follow from that, and both matter for reading the numbers below. It is a manufacturer figure for illuminance rather than a PPFD measurement, and I have not tested it. And because the shade never came off, whatever it contributes is already inside every figure in this article. It is not a percentage to add on top.
- Format
- 90P, 90 × 45 × 45 cm, rimless
- Estimated operating water volume
- approximately 142 L (~37.5 US gal) after substrate, equipment displacement and headspace
- Substrate
- ADA Amazonia Ver.2 over Power Sand
- Layout
- Dutch-inspired street planting, nineteen live species of an original twenty
- Fixture
- ADA Solar RGB, single pendant, centered over the tank
- Fixture accessory
- ADA Shade fitted, and fitted for every reading below
- Photoperiod
- 9:30am – 4:30pm
- Output control
- None. This fixture has no dimming: it is on or it is off
Measurement Equipment
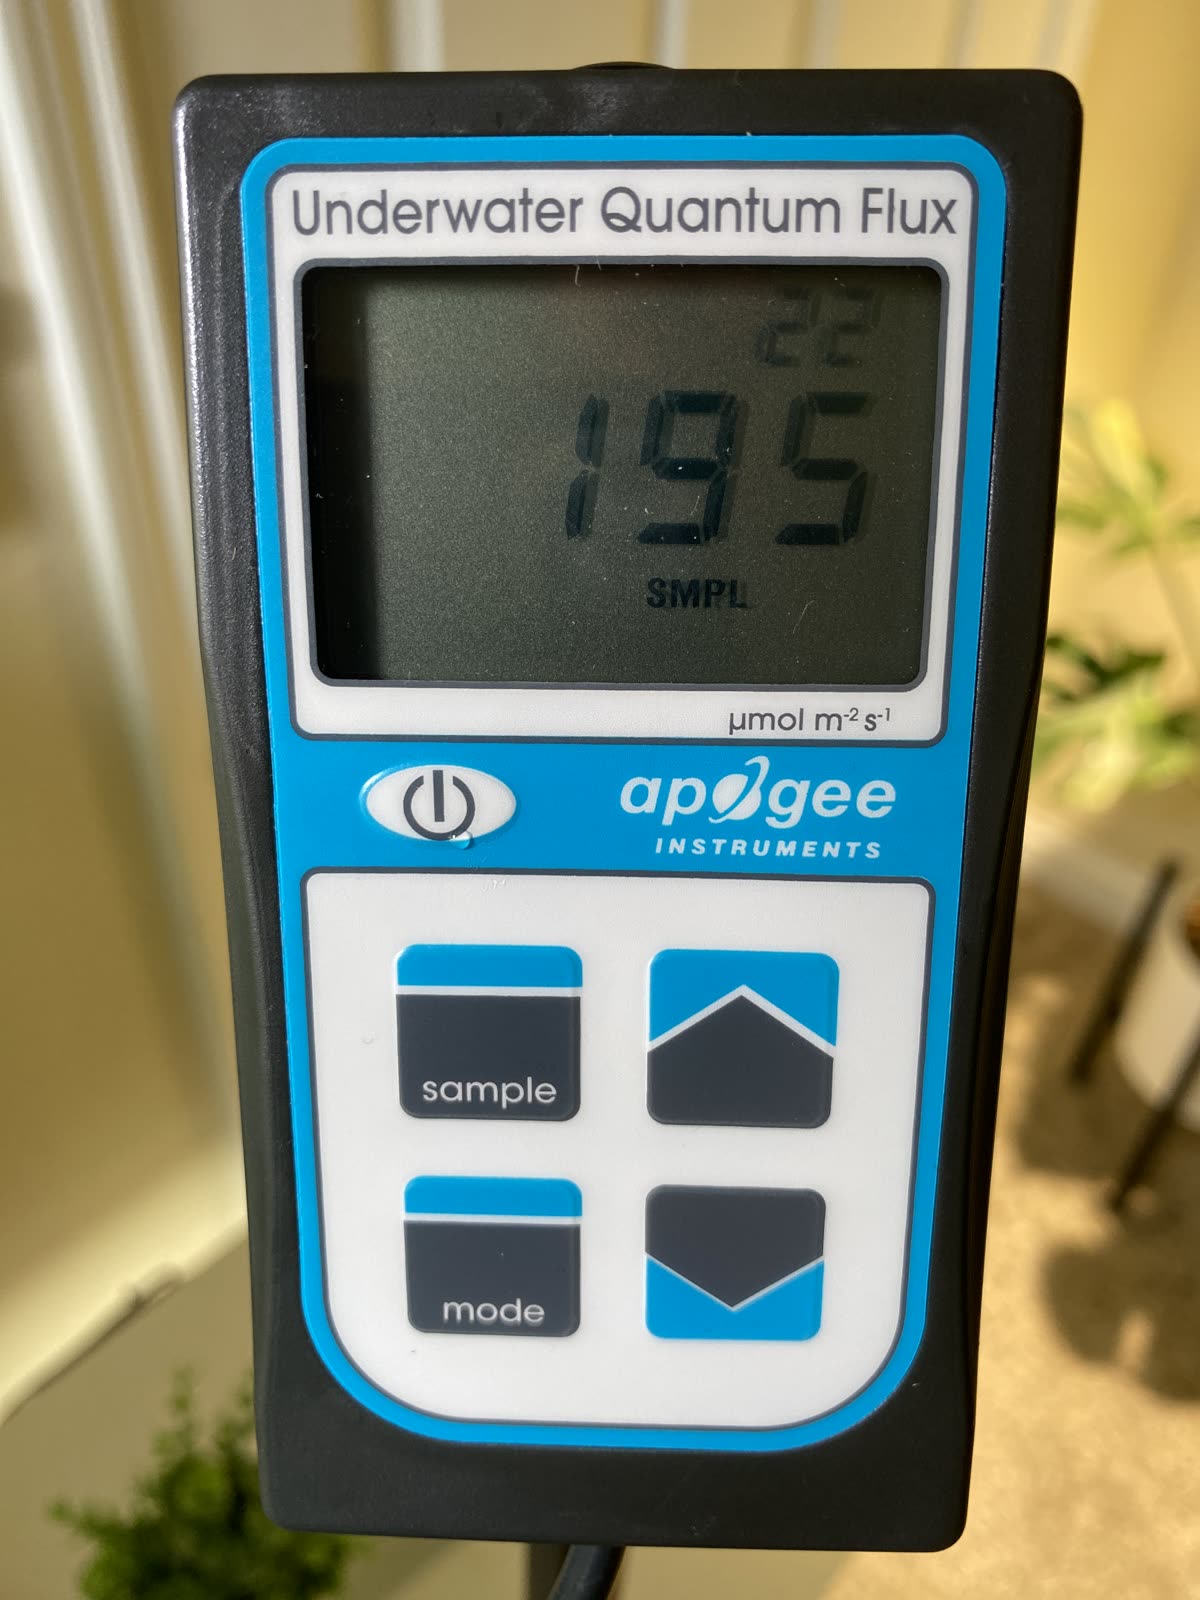
The sensor goes in the water. Readings taken above the surface do not describe what reaches a plant.
One correction is worth being explicit about, because it is easy to mistake for a spectral one: a quantum sensor calibrated in air reads low underwater. The MQ-510 applies its underwater immersion correction internally. No post-processing correction was applied to any reading here, and whatever the meter applies it applies identically to all of them.
I have not checked it against a reference, so I cannot vouch for absolute accuracy beyond the factory calibration and the ± 5% Apogee states for it. Every reading came from the same meter held the same way, which is what makes them comparable to each other regardless.
- Instrument
- Apogee MQ-510 underwater quantum meter
- Quantity measured
- Photosynthetic photon flux density (PPFD)
- Units
- µmol·m⁻²·s⁻¹
- Spectral range
- 389–692 nm ± 5 nm, per Apogee's published specification
- Underwater correction
- The meter applies its underwater immersion correction internally; no post-processing correction was applied
- Calibration
- Factory calibration, stated by Apogee at ± 5% uncertainty; no field recalibration performed
Measurement Procedure
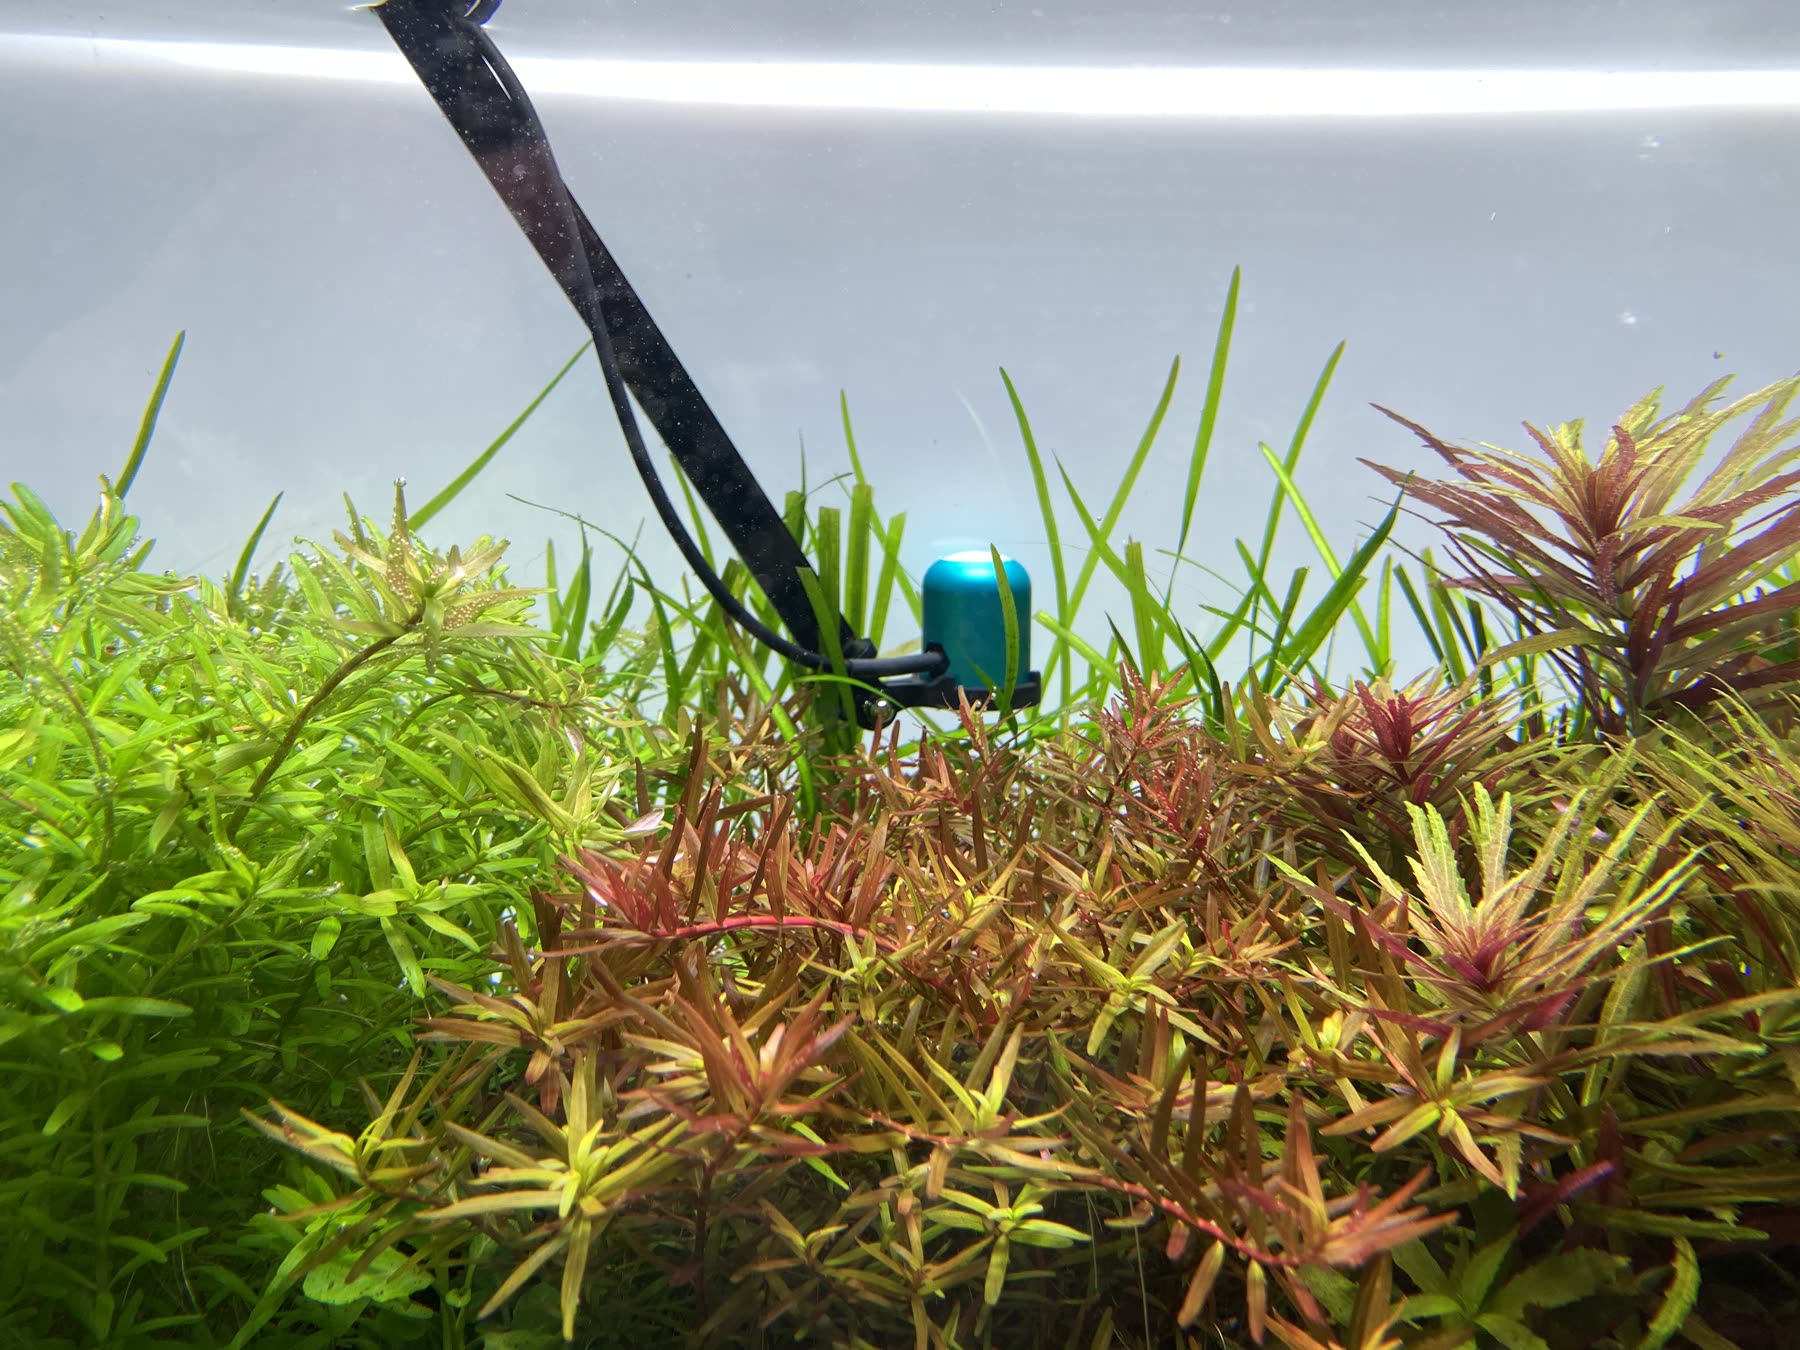
Keeping the sensor level matters. Tilt it and the number changes without anything in the tank changing. I did this by hand, which is in the limitations below.
- 01Allow the photoperiod to reach its steady state. There is no output level to set, because the original Solar RGB has no dimming.
- 02Reduce ambient room lighting so the aquarium light dominates.
- 03Confirm the water is clear and the surface is free of film, since both alter transmission.
- 04Submerge the sensor and hold it level at the target location.
- 05Allow the reading to settle before recording it.
- 06Record the value against the numbered position, not against a description.
- 07Repeat for every position in the same order each time the survey is run.
Measurement Locations
I measured at the plants rather than on a grid, which makes the numbers useful for placement but means this is not an even sample of the tank floor. The position numbers stay fixed between surveys so I can compare them later, one spot at a time.
Environmental Conditions
Conditions held during the survey: aquarium light on, at the only output it has, with the ADA Shade fitted, room lighting minimized, water clear, readings taken mid-photoperiod.
Depth and fixture height are recorded against every reading in this survey. The fixture was at 12 inches above the water throughout, which is about 30 cm, the same distance ADA quotes its own illuminance figures at. Sensor depth ranged from 4 to 15 inches depending on the plant, which is why it is stored per reading rather than as one condition for the survey: the canopy of a foreground carpet and the canopy of a background stem are not at the same depth, and a single number for both would look like data while describing neither.
Raw PAR Measurements
Every reading, exactly as logged. Nothing smoothed, nothing dropped. Pulled from the database at page load, so it is the record itself rather than a copy.
| Position | PPFD | Depth | Working range | Vendor list | Deviation |
|---|---|---|---|---|---|
| 02 Lobelia cardinalis 'Mini' | 123 | 10″ | 50–90 | no entry | +33 |
| 03 Alternanthera reineckii 'Mini' | 110 | 10″ | 70–110 | no entry | in range |
| 04 Myriophyllum 'Guyana' | 115 | 10″ | 40–70 | 100–150–200 | +45 |
| 06 Rotala 'Orange Juice' | 115 | not recorded | 70–110 | 100–150–200 | +5 |
| 07 Rotala 'Blood Red' | 80 | not recorded | 90–150 | 100–150–200 | -10 |
| 08 Limnophila hippuridoides | 175 | 6″ | 70–110 | 100–150–200 | +65 |
| 09 Pogostemon stellatus | 70 | 6″ | 70–110 | 100–150–200 | in range |
| 10 Hygrophila 'Kompakt' | 80 | 6″ | 40–70 | 150–200–250 | +10 |
| 11 Ludwigia arcuata | 80 | 6″ | 60–100 | 100–150–200 | in range |
| 13 Staurogyne repens | 100 | 6″ | 25–50 | no entry | +50 |
| 14 Micranthemum 'Monte Carlo' | 100 | 6″ | 50–90 | no entry | +10 |
| 15 Alternanthera 'Super Magenta' | 125 | 6″ | 70–110 | no entry | +15 |
| 18 Ludwigia 'Pantanal' | 100 | not recorded | 90–130 | 100–150–200 | in range |
| 20 Rotala macrandra 'Mini' | 100 | 6″ | 90–130 | 100–150–200 | in range |
PPFD Distribution
The same numbers placed where they were taken. The table does not show you that the bright part is concentrated and sitting off to one side. This does.
Plant-by-Plant Results
The table above compares each position against a working range for whatever is planted there. Those ranges are this project's own targets. They are not published thresholds, and the next section explains why there are none to use, so treat every deviation as a prompt rather than a verdict.
Where these ranges come from
They come from this project. That is an unsatisfying answer, so here is the work behind it.
Setting out to find a defensible published number for each species, what turns up is four sources that disagree with one another by up to five times. Not at the margins. On what counts as high light at all.
- Aquarium Co-Op
- 10–20 low, 20–35 medium, 40–50 and up for high
- 2Hr Aquarist
- 20–40 low, 40–90 medium, 90–150 high
- Seneye, from Arcadia
- 100–150–200 as minimum, ideal and maximum for most genera in this tank. Hygrophila 150–200–250
- Photosynthesis research
- Saturation at 200–400 for one submerged leaf, rising toward 1500 in a dense stand
What the four disagree about
- /What Aquarium Co-Op calls high light, 2Hr Aquarist calls the low end of medium. Both are large, well regarded, and writing about planted tanks. They are also writing for different tanks, since Co-Op's audience is largely running without CO₂ and this tank is injected.
- /The Seneye table is the only per-plant PAR reference the hobby has, and it is the reason a per-species list looks sourceable in the first place. Seneye state it was produced in association with Arcadia. Arcadia sells aquarium lighting. It is also the source asking for the most light, and a Barr Report thread raised that objection about it in 2015.
- /It is genus-level regardless. One figure covers Rotala macrandra and Rotala wallichii alike, and it names no entry for Staurogyne repens, Micranthemum, Alternanthera or Lobelia. Four of the nineteen positions here are plants it does not cover.
- /The research answers a different question. Light saturation is the point where more light stops producing more photosynthesis, which is not the point where a plant colors up best. Every reading in this survey, the 196 included, sits below the saturation figure for a single submerged leaf.
- /The number is not a property of the species in any case. Vallisneria natans grown under dim light saturates at 81. The same species grown bright saturates at 155. Nearly double, from light history alone.
Why these are working targets
Averaging the four was considered and rejected. They are not four estimates of one quantity. They are answers to different questions asked about different tanks, and the mean of a lighting company's figure and a no-CO₂ figure describes nothing. Publishing the disagreement is more useful than hiding it inside an average.
So the working range column is a starting position held by this project, open to correction. The vendor list column sits beside it so the one available reference can be seen disagreeing, and it disagrees sharply. Hygrophila 'Kompakt' is kept here at 40–70 and that table asks for 200.
What will settle it is not another source. It is this tank. Nineteen positions, a named meter, depth recorded on every reading, and a growth record accumulating against each one. In a year the observed result at a given position is worth more than any figure above, because it is the same plant under the same light at a known depth. That is the argument for measuring instead of looking it up.
All six sources below were read on the 9th of August 2026, and every figure quoted from them is what they said on that date. Pages get revised. If one of them no longer reads the way it is quoted here, the quotation is the record of what was there, and the link is provided so anyone can check.
Aquarium Co-Op on PAR · 2Hr Aquarist on PAR · The Seneye plant list · Barr Report thread · Underwater photosynthesis review · Vallisneria acclimation study
Observations
- /The highest reading is more than three times the lowest. 196 at one end of the range, 55 at the other, with a mean of about 107.
- /The high numbers sit in the middle and toward the back. The low ones are at the far left and far right.
- /The falloff tracks horizontal position, not sensor depth. The ten positions in the middle of the tank average 129 µmol at a mean depth of 9.7 inches; the six in the outer fifth at each end average 72 at a mean depth of 9.4 inches. Those two groups sit at effectively the same depth, so the gap between them is not an artifact of where the sensor was held.
- /The two extremes make the same point on their own. The shallowest reading in the survey, four inches down and closer to the fixture than anything else, is 70 µmol near the right end. The deepest, fifteen inches down, is 120 µmol dead center. If depth were driving the spread those two would be the other way round.
- /The front-to-back numbers were lopsided, which is what made me go and look at how the light was actually hanging.
- /Eight positions read above the working range for whatever is planted there and none read below it, so where readings fall outside the range they do so only on the high side.
Unexpected Findings
Two things came out of this that I did not expect.
The original Solar RGB still produces strong center output after roughly six years of use, while PPFD varies substantially across the tank. Measured against a practical working range for each species, no position reads below its range: eleven sit inside it and eight above. The standing survey demonstrates highly uneven PPFD distribution across this 90P. It does not yet establish that the lower outer readings are biologically limiting.
Those two things are not independent, though, and it took me a while to see why. The lever for coverage is mounting height: lift a fixture and the footprint widens. But lifting it also costs intensity everywhere, which is what appears to have made the ends worse when I raised mine. It had no surplus output to spend. A fixture with meaningfully more output could pay for that height and come out ahead at the edges, though that is a prediction rather than something I have measured. Extra brightness is not the goal in itself; it is the currency you spend on spread.
My working hypothesis is that lower outer PPFD may contribute to the coloration differences that originally prompted the survey, but the current measurements do not isolate light from nutrition, maturity, plant placement, or other variables.
The light was also hanging about an inch off-center front to back. I only found that because the numbers were lopsided and nothing else explained it. It looked fine. It had presumably looked fine for years.
Experiment 001 · PAR mapping · Experiment 002 · Mounting height
Limitations
- /The sensor was hand-held. Position and orientation are repeatable to the precision a hand allows, not to a fixed jig.
- /Nineteen of the twenty positions are covered. Position 5 is absent because the plant there died, not because the reading was skipped, and a position that no longer has a plant at it is a change in the layout, not a gap in the survey.
- /The survey is a single time point. No repeat measurements were taken to establish variance between runs.
- /Readings were taken at the plants' current heights during grow-in. As stems grow, the leaves that matter rise toward the light and these figures will no longer describe them.
- /Every reading is a canopy reading, taken between 4 and 15 inches below the surface in a tank 17.7 inches deep. There are no substrate-level readings in this survey. This matters for any comparison: a figure quoted for a fixture is often taken at the substrate, and a canopy reading during grow-in sits several inches closer to the light. The two are not interchangeable, and the higher numbers here are the shallower ones. Measuring the same positions at substrate level is Experiment 005 and has not been run.
- /Only the factory calibration stands behind absolute accuracy; no independent reference was used.
- /One aquarium, one fixture, one room. Nothing here establishes what a different tank would measure.
What These Measurements Do Not Establish
- /They do not establish that any plant will or will not color up. Light is one input among several.
- /They do not grade the fixture. A measurement of distribution on one 90 cm tank is not a verdict on a product.
- /They do not define requirements for any species. The working ranges used for comparison are reference figures, not thresholds.
- /They do not describe any other aquarium, and should not be transferred to one.
- /They do not account for CO₂, nutrient availability, flow, water clarity over time, or the plants' own history, all of which bear on the outcome the light is often blamed or credited for.
Conclusion
Measuring nineteen spots instead of one changed my answer. The question I started with, whether the light was strong enough, was the wrong one. The fixture still produces strong center readings, and what the survey demonstrates is that the falloff runs left to right: the ten positions in the middle of the tank average 129 µmol and the six in the outer fifth at each end average 72. Whether that difference matters to the plants standing in it is a separate question this survey does not answer.
It saved me from buying a light on an assumption that turned out to be wrong, and sent me looking at fixture position instead, where the numbers found something looking at the tank never had.
Experiment 002 · Mounting height · Experiment 004 · Solar RGB II · Experiment 005 · Canopy PAR · Project roadmap